
2020 performance: a robustness check
If you’ve perused the FAQ section of this site, you know that I don’t directly hold the stocks recommended on this site in my personal account. That’s to avoid even the appearance of “front-running”—an unfortunately common (and also illegal) practice unsavory stock-selection newsletters have used that involves taking a position in a stock and then touting it and expecting to profit from others buying it up on your recommendation. But in the FAQs I note that, for a systematic trading strategy like Stoney Point’s, there’s an epistemological advantage to not buying the picks recommended here: I get to apply the exact same model to an entirely different universe of stocks, and therefore see if the model is robust “out-of-sample.” In data science, they call this “cross-validation.” Here’s what I wrote in the FAQs:
To the extent Stoney Point and its members use the models/strategies in investing company or personal funds, the models/strategies are applied to other stock universes, ensuring we never hold the same stocks in self-managed funds that we are publishing as our stock picks, but nevertheless allowing us to capitalize on our conviction in the strategy. Applying the Stoney Point strategies to other stock universes is intellectually useful as well: it allows us to cross-validate the strategy on what essentially amounts to a “holdout” sample, providing a test of the validity of the models.
Now that calendar year 2020 has reached it’s natural conclusion, and now that I’ve published some unaudited performance results for Stoney Point’s public picks (see here) it makes sense to take a look at how Stoney Point’s strategy performed in my personal portfolio as a robustness check. Unlike the public picks I publish here, which I select from among the S&P 500 constituents (excluding financial sector stocks), I select the picks in my personal portfolio from among the constituents of the S&P 1500 (excluding both financial sector stocks and all S&P 500 stocks). First, a couple of computational details, and then the results.
The results below are adjusted to exclude the impact of inflows and outflows. Naturally, if you have a portfolio worth $100, and then you add $10 to it in the middle of the year, and it ends up at $110 at the end of the year, your investment return wasn’t 10 percent, it was 0 percent (you have to subtract the effect of the contribution). In formal language, these are “time-weighted” returns.
I started applying the Stoney Point strategy to S&P 1500 (ex. financial sector stocks and ex. S&P 500 stocks) in early May, when I first started publishing Stoney Point’s picks (again, to avoid any possibility of any appearance of front-running). So January through April in the chart below isn’t really that informative of the strategy.
Throughout the entire year, I had a pretty sizeable allocation to the SPY ETF, which underperformed my portfolio overall. I had a smaller allocation to DBO (an oil futures ETF), which was actually down over 20 percent in the year. What that means is that the results below actually significantly understate the performance of the portion of my portfolio that was actually implementing Stoney Point’s strategy. I haven’t done the math myself yet to figure out the magnitude of the understatement, but in case you want to get a rough estimate yourself, about 30 percent of my portfolio was in SPY at the start of 2020, and between 5-10 percent was in DBO. I also had a de minimis legacy position in QCOM.
I’ve included a few different comparators in the chart below. First, I show the results for SPY, since it’s the single most active ETF in the world by some measures and the S&P 500 is a widely followed measure of the performance of U.S. equities overall. Second, I show results for two “target-date” funds from Goldman Sachs, one designed for people retiring around 2060, and one designed for people retiring around 2040. I include these because these are the sorts of funds that many Americans invest in through their 401(k) funds through their employers. I suspect these options (SPY or target-date funds) are pretty good proxies for what the average person might expect to get on their own (without Stoney Point’s help).
The punchline: the personal portfolio partially applying Stoney Point’s strategy (out-of-sample!) beat SPY by over 10 percentage points over the entire year, and beat the two Goldman target-date funds resembling common 401(k) investments by about 20 percentage points. And that’s despite not even applying the strategy in the first four months, and despite lower-performing allocations to SPY and DBO throughout the whole year.
Stoney Point personal account performance
(selecting from S&P 1500 ex. fin. ex. S&P 500)

A natural question, given the returns above, is whether the outperformance in the year is just compensation for risk. The market itself (as proxied by SPY) was up for the year, so if the picks Stoney Point’s model would dictate are correlated with SPY, but also riskier, you’d expect them beat SPY (assuming risk and return are correlated in general, which is a bedrock principle of finance). We can bring that question to the data to gather some evidence.
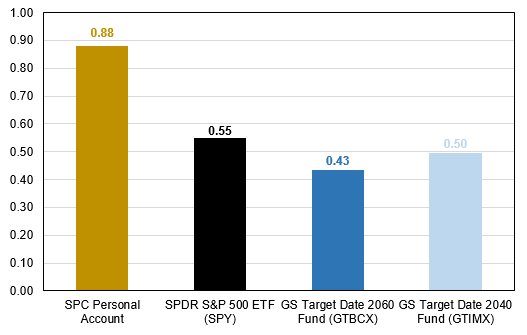
The simplest way to do that is to compare the four comparators in the chart above in terms of a measure of returns that accounts for risk (or variance) of the returns each earned. I’ve done that in the chart below. Specifically, I took the standard deviation of daily returns for each of the comparators above and annualized each to get a measure of realized volatility in the year. I then took the total return from the chart above for each comparator, and divided it by its volatility to get a “reward-to-volatility” ratio. Conceptually, this is very similar to the Sharpe Ratio reported by mutual funds and hedge funds (and essentially identical when the risk-free rate of interest is approximately 0 percent, as it has been in 2020).
The chart below shows how the comparators above line up in terms of this risk-adjusted measure. As the chart details, the personal portfolio partially using Stoney Point’s model significantly outperformed both the market and the Goldman target-date funds not just in terms of gross performance, but also on a risk-adjusted basis. That is, for each unit of volatility borne, my personal portfolio using Stoney Point’s strategy out-of-sample generated considerably more return than either SPY or the Goldman target-date funds.
Reward-to-volatility ratios
One more note: these results are for my personal portfolio, but I’m pleased to announce I will likely have another out-of-sample robustness check in the future. That’s because Stoney Point’s company account started trading today, the first trading day of 2021.