Looking to the past
“…a favorite theory of mine [is] that no occurrence is sole and solitary, but is merely a repetition of a thing which has happened before, and perhaps often.”
-Mark Twain [11]
Background
It’s important to say up front what the historical performance of our picks is not: a guarantee of future performance. Stoney Point is not an investment adviser, Stoney Point’s commentary is of a general and impersonal nature, and Stoney Point’s stock picks do not constitute investment advice. Investing in stocks and other securities entails risks, and you should consult your registered investment adviser about your specific investment objectives.
No matter how well studied a strategy may be, applying that strategy in the future is necessarily extrapolating outside of the historical sample space. The visible and invisible laws governing the market (to the extent they exist) may be different in the future than the were in the past. It is always possible that attractive historical performance could be anomalous, resulting not from some underlying "truth" captured by the strategy, but by complete coincidence entirely detached from any real meaning. While testing a strategy out-of-sample (e.g., in other markets or time periods) can mitigate such concerns, nature's ability to deceive through randomness can never been ignored entirely. Attractive historical performance could also be the result of data-mining, when strategists derive investment theories to explain the data rather than using the data to test theories deduced independent of the data.
At a minimum, it’s important to understand the assumptions made when assessing the historical results of stock-picking strategies. To that end, the figures shown on this page reflect the following assumptions. Altering these assumptions over the investment periods illustrated could cause the results to differ.
Initial investment on the date indicated and rebalancing using Stoney Point’s Prime and Select models (respectively) at the end of each month.
Sample of potential investments evaluated at all points in time are non-financial sector stocks in the S&P 500 Index as it was constituted at the time of portfolio formation.
Portfolio includes the top 10 stocks as ranked by Stoney Point’s Prime and Select models as of the last re-balance date, weighted equally as of each investment date.
Securities prices are adjusted for splits and dividends. Dividends are assumed to be reinvested in the portfolio at the end of the month.
Pricing is at mid-spread open and close prices.
Data is provided by third parties (see terms here for details).
Assumes no trading commissions (while trading commissions were ubiquitous historically, today they are 0 percent at many brokerages [13]). Returns are gross of Stoney Point subscription costs as the impact of subscription costs on returns depends on the amount of capital invested pursuant to the strategy.
Assumes no trading volume-related pricing effects.
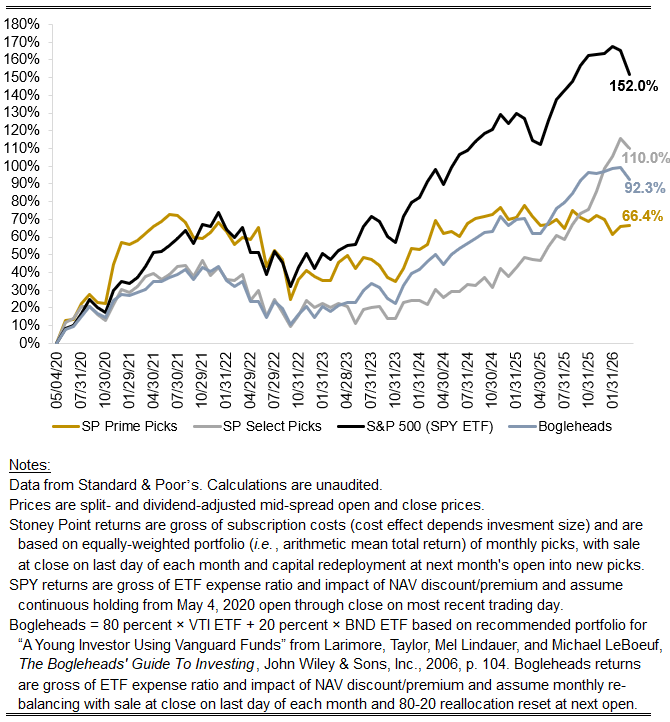
Total performance history
See this month’s picks and all past picks for Stoney Point’s Prime model (subscribers only) and Select model (free) here.
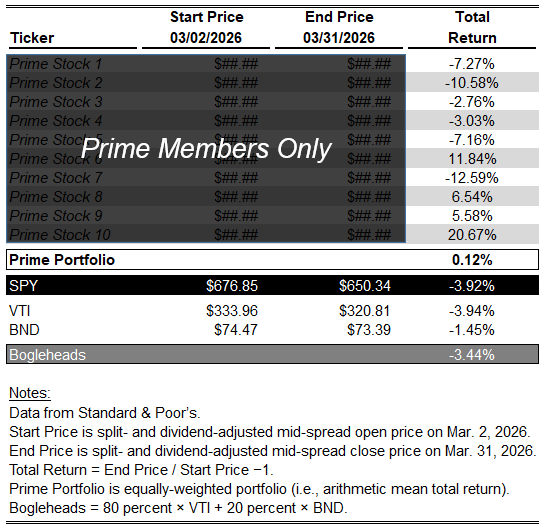
Last month’s Prime picks
See this month’s picks and all past picks for Stoney Point’s Prime model here (subscribers only).
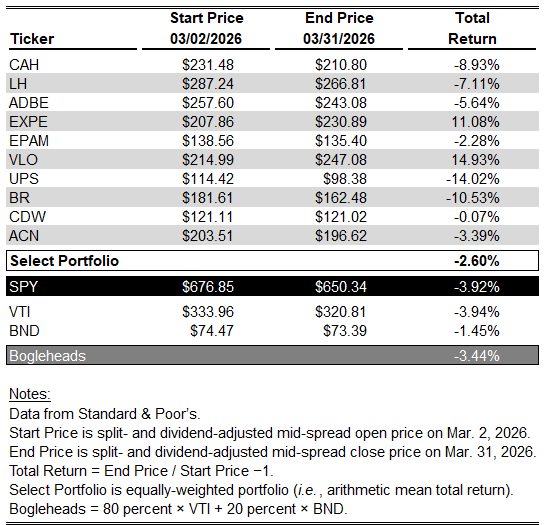
Last month’s Select picks
See this month’s picks and all past picks for the Stoney Point Select model here (free).