September 2022 performance update
Hi friends, here with a performance update for the month. If you’ve been following the news, you probably understand it was a veritable nightmare of a month for capital asset prices. Currently, 30-year fixed rate mortgages are running about 7 percent in the U.S., the GBPUSD rate is near parity, and as of this writing there are rumors on Twitter that a major international investment bank is “on the brink.” As Matt Levine pointed out in Bloomberg this week, certain pension funds in the U.K. received margin calls receive, so it isn’t all that crazy to assume that most major pools of capital have experienced steep losses and, as a matter of sheer probability, some are probably having liquidity or even solvency problems.
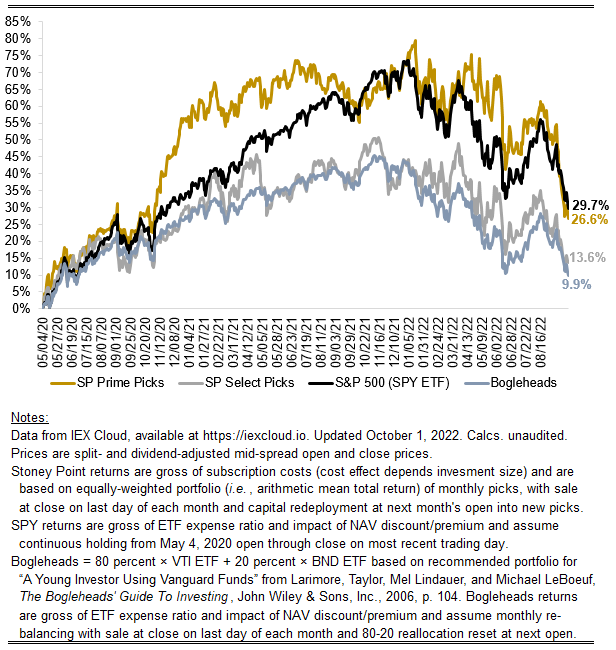
Stock markets were down big this month. Our Prime model was caught especially flat-footed, though Select outperformed the market. Here are the numbers:
Prime: -15.59%
Select: -7.11%
S&P 500 (SPY ETF): -8.72%
Bogleheads model (80% VTI + 20% BND): -7.69%
In terms of a post-mortem analysis, I think I have a pretty good understanding of why Prime was shredded last month. Less interesting (and, I think, controversial) than the “why” I will offer is whether it could have been foreseen. The why (perhaps one among others): Prime was unusually heavily concentrated in logistics providers last month. Careful readers may have noticed that among the Prime picks last month were UPS, Fedex, CH Robinson, and Expeditors International of Washington, all of which were hit hard and down more than the market overall. These aren’t exactly companies that one would expect to perform well heading into a recession—such as the recession that the market is now pricing and is being discussed daily in the media.
These stocks surely looked attractive to our algorithm because it extrapolates past profitability into the future and compares that to price (like any “value”-oriented approach). The upside to that strategy is that it aligns with the empirical observation that, historically, such “value” portfolios outperform. A natural downside is that it doesn’t reflect rapid shifts in sentiment, such as what markets experienced last month. In fact, it in a rapidly downshifting environment, the algo likely actually adversely selects worse-than-average stocks (focusing only on near-term performance). That is because prices, being market-based data points, adjust at a high frequency, unlike accounting data, which is reported at a low frequency. When prices for some stocks fall sharply, our model sees those stocks as “discounts” (assuming the infrequently reported accounting data still look good). But that begs the question of why did the prices go down in the first place? In an efficient market, the price declines can only be interpreted as the market seeing darkness on the horizon that isn’t quite picked up in earnings yet.
Of course, I don’t interfere with the model and try to step in and make alterations to account for factors it may not pick up. I think my attempt to do so would be guesswork and I would be wrong as often or more than I would be right. More important, my belief is that the model should outperform over the long term (a multi-year horizon) without such interference, even if there are hiccups along the way. Empirically, that is true when backtesting historically, and in terms of performance assessment for posterity such interference would contaminate results and cause serious replicability issues and doubts about out-of-sample validity.
The results do bring questions to the fore and that I have raised in the past about whether it makes sense to incorporate automated sentiment indicates in the algorithm. Many quants do this (a simple example would be to have the model look at trends in the relationship between the recent simple moving average of price and a longer-term historical simple moving average, or to incorporate proxies for the well-established “momentum” concept). I’m working on some things on this front that I will plan to incorporate by year end. Results are promising so far, and a few of these sentiment indicia are things that theoretically make a lot of sense (unlike many “technical” indicators) but that few, if any, seem to be using (or least no one seems to be discussing).