November performance update
Hi friends, here with a monthly performance update for November:
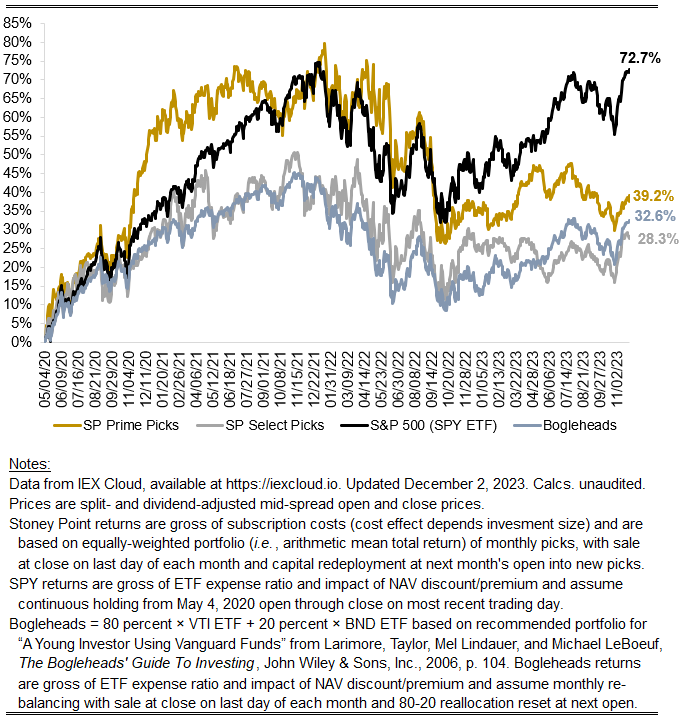
Prime: +5.25%
Select: +8.22%
SPY ETF: +8.87%
Bogleheads Portfolio (80% VTI + 20% BND): +8.25%
Under typical circumstances I would be overjoyed about a 5.25 percent monthly return (~85 percent when annualized) for SPC’s flagship strategy and a 8.22 percent return for the “B-team” Select strategy. Of course, November was explosive for the market as a whole, with SPY up 8.87 percent, besting its average annual return historically. The macroeconomic backdrop would seem to have been unusually supportive of the value of corporate assets , with a consensus emerging this month that a so-called “soft-landing” (deceleration in consumer prices without a recession) is on offer.
It’s worth dwelling on the picture below for a moment, which starts early in the pandemic and tells quite a story. There was a sharp rise in equity values concurrent with policy measures that rendered money unusually cheap (lowering hurdle rates and raising NPVs, in the case of monetary policy; raising profit expectations and thus raising NVPs, in the case of fiscal policy). This effect was not unique to corporate equities, of course — residential real estate equity investments experienced the same lift, for example, as did many other assets/products. Price appreciation across the economy is, by definition, inflation of the sort that concerns central bankers, warranting the reverse policy response (higher rates, lower NPVs) which is the story of 2022 in the chart. But here we are in 2023 and, despite more fits and starts, the trend kind of parrallels 2020/2021 (for the market overall), which is just kind of extraordinary! Consider what the 72.7 percent for the SPY ETF implies: the capital stock of the S&P 500 is worth nearly twice as much in aggregate as it was in May of 2020, three and a half years ago. That rate of appreciation dwarfs the base rate one would extrapolate from the history of that index dating back to the 20s, and probably similar composite indices that date back to the 19th century. I expect — but haven’t checked — that it dwarfs the rate of return on a hypothetical index one might construct that includes stocks all the way back to the 1700s and 1600s (e.g., V.o.C., B.o.E., etc.).
The comparison of the black line to the others also tells a story: compared to S&P 500, the Stoney Point strategies heavily weight indicia that characterize “value stocks” (low market values relative to fundamental/theoretical drivers of value). This is by design, though the market has rewarded it comparably less lately. The Bogleheads portfolio also differs from the SPY ETF in ways that are important for understanding the chart. Notably, the Vanguard VTI ETF (which gets 80 percent in the portfolio), tracks the CRSP US Total Market index, which reflects the performance of a much wider cross section of U.S. equities than the S&P 500, including mid- and small-cap companies. Smaller equities have also been rewarded less lately, particularly in 2022. But there are reasons to think that is changing alongside the emerging consensus about a soft landing: in November, the most widely followed U.S. small-cap index, the Russell 2000, was up nearly 12.5 percent, that is to say roughly a third better than the S&P 500.
One footnote I would be remiss not to mention: I’ve incorporated a few additional value indicators into the SPC model starting with December’s picks. Some of these are novel, some less so; the philosophy behind including them is to gain precision in identifying “value” stocks. The denominator for all of these “value” ratios is the same: current price. Realized returns are tautologically equal to End Price / Current Price - 1, so value ratios equal to x / Current Price (where x is some fundamental determinant of value) are all different ways of extracting information about the overall market’s expectation for future returns. Where value-oriented investors often disagree is what the best “x” is.