January performance update
Hi Friends, here with a performance update for January.
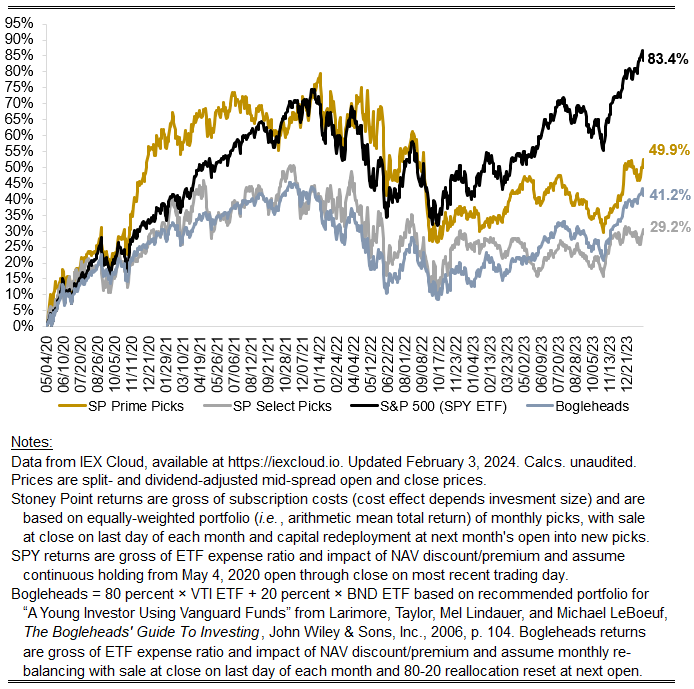
Prime: -0.35%
Select: -0.10%
SPY ETF: +2.27%
Bogleheads portfolio (80% VTI + 20% BND): +1.36%
It wasn’t a great month for value stocks, coming on the heels of a full-year 2023 where growth beat value by a substantial margin. That’s a pretty good description of the last decade or so, when growth consistently beat value, defying the observed “value premium” that is fairly robust in historical stock market returns data. I don’t expect the recent experience of growth beating value to persist forever, for sensible reasons (the question is for how long?) and I’m not alone.
To use one crude but common measure, value stocks tend to have low price-to-earnings (P/E) ratios while growth stocks tend to have high P/E ratios. There lots of other ratios, but they generically are trying to do the same thing: normalize a capitalized asset value by a proxy for the cash flows the asset throws off. No one would disagree that the value of an asset should be the risk-adjusted present value of its expected future cash flows. Assuming future cash flows are a function of current cash flows (e.g., earnings tomorrow = earnings today + growth in earnings between today and tomorrow), valuation ratios like P/E simply proxy for the reciprocal of expected returns. I say “proxy” because the the “E” is earnings, not cash flows, and is usually a measure of current earnings, not future, earnings; but these technicalities affect the measure for all companies, so when you look at the cross-section of P/E ratios you should get a ranking of companies that approximates an ordering of their expected returns, with a healthy dose of error.
A little more formally, say P = CF1/(1+r)^1 + CF2/(1+r)^2 + … CFN/(1+r)^n, where P = price today, CFi = cash flow for the ith year, r is the discount rate or the expected return on the stock, and n goes to infinity. In a simple model where r is assumed constant and cash flows grow at a constant rate, this all collapses to roughly P = CF0*(1+g)/(r - g). For a stock, dividends are the relevant measure of cash flows, and dividends equal earnings (E) - reinvested earnings, or earnings * (1 - IR) where IR is the investment rate. So the simple equation becomes P = E*(1+g)*(1-IR)/(r-g), and more complicated versions of it aren’t too different, at least not in ways that are important for this point. Factor out the E and divide both sides by it to get P/E = (1+g)(1-IR)/(r-g). That is, P/E is a function of growth, investment, and expected returns. All else equal (growth and investment), a relatively higher P/E (growth stocks) should be associated with a lower r in the cross-section of stocks, and a relatively lower P/E (value stocks) should be associated with a higher r in the cross-section of stocks, which is the historical empirical pattern — just not lately. That is a mechanical explanation, but a more intuitive one is something like the following: take the reciprocal of P/E (that is, E/P) and think about what it means for one company to have a higher E/P (value stocks) than others. All else equal, it means the market has bid down the price of that company, demanding higher returns (in expectation) to bear the risk of holding that stock, i.e., the stock price itself tells you something about the returns the market overall is demanding and therefore must expect to hold that stock, and you just need to normalize it appropriately to extract the signal the market is giving off about its returns expectations.
With all that in mind, the “growth premium” lately is sort of puzzling. But it makes a little more sense when you consider that, collectively, the stock of just six companies has a weight of almost 1/3 of the entire S&P 500. Those are Microsoft, Apple, Nvidia, Amazon, Meta, and Alphabet (Class A and Class C). Nvidia alone (~4% weight in the overall index) was up 25% in January and has been explosive over the last year. Together, the six companies contributed 1.68% to the index’s roughly 2% gain on the month (or roughly 3/4 of the SPY ETF’s return). The prospects of those companies may merit the returns they’ve experienced, but being so richly valued from a P/E standpoint and then subsequently experiencing relatively high returns, as we have seen over and over again with these companies in recent years, sort of implies their high returns of late aren’t manifesting for reasons that were obvious a priori. Otherwise, they probably would have had lower P/E ratios, say, a year ago, than they did. Rather, that fact pattern suggests to me that their prospects have continued to surprise to the upside. It’s worth asking if it is reasonable to expect not just good results to persist, but for results to continue to be better than everyone currently expects.