January 2022 performance results
[Hi friends, here with a January performance update. Overall, it was a great month for us with significant relative outperformance compared to benchmark indices. The key numbers:
Prime: -3.04%
Select: -1.49%
SPY ETF: -5.54%
Bogleheads: -5.52%
The Nasdaq fell 8.99 percent — nearly surpassing its worst one-month decline ever of 9.89 percent in 2008. Cathie Wood’s famous “Innovation” ETF (ticker ARKK) was down 20 percent. Bitcoin was also down 20 percent in its worst January since 2018, arguably blowing up the argument that crypto is fundamentally uncorrelated with other risk assets.
What happened in January—after what has undisputedly been an extraordinary, multi-year run for large-cap growth stocks—was, in my view, the collapse of a decade plus-long “free float” period in which the cost of debt-financed capital was essentially zero. Axiomatically, long-duration assets—assets where long-in-the-future cash flows contribute disproportionately to present value compared to nearer-term cash flows—disproportionately benefited from what has essentially been free money. Math dictates those asset would be hit hardest in a tighter monetary policy environment, and the transition to a new, higher-rate regime the likes of which the world has not seen since 2008 or earlier is indeed upon us.
It is no coincidence that “value”-oriented strategies, which tend to construct portfolios comprising lower-duration stocks, underperformed (compared to history) in the free-money environment of the last decade or so. A corollary, I think, is that they should outperform in a non-free-money environment. The important question is: which environment is “normal”, and therefore should be expected in the future. No doubt policymakers have realized the sky did not fall when rates were low, so it is possible we will find ourselves in periods of ultra-low rates in the future. But my bet is that negative real rates can't persist forever, and aren’t likely to systematically persist in the future.
One can see a bit of the “rotation” from growth to value in Stoney Point’s recent performance. The first chart below shows the substantial departure of Prime from the overall S&P 500 since the start of November. Note that market conviction that the Fed would start tightening policy arguably gained significant strength on November 3, 2021, when the Fed announced it would decelerate its asset purchases by $15 billion per month.
The second chart below shows our Select strategy breaking away from the market in January and converging with Prime, making up for its slower departure from the market benchmarks.
Nov. ‘21 Through Jan. ‘22 Performance
(Index: 11/2/21 = 100)

January Performance
(Index: 12/31/21 = 100)

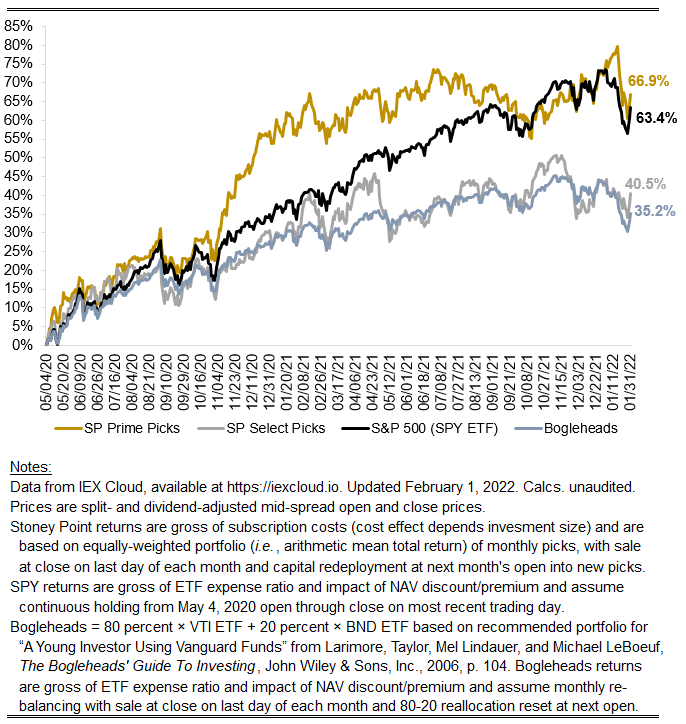
As always, the chart below shows our total performance history.