
Is a stock market “correction” coming?
I don’t spend a lot of time talking about asset allocation on this blog, because this blog is focused on equities. For the moment, this blog is mostly agnostic about other asset classes and when and how people move money among them. A priori, I don’t think most people are very good at timing the market (including me!)—and, why would they be, since no one can predict the future very well, much less predict it better than everyone else they are competing with in capital markets, which is what you need to be able to do to be very, very good at that sort of thing.
With that said, a lot of people think U.S. stocks are due for a big correction:
Here is what Jim Cramer has to say: “September is the cruelest month, and it’s playing out that way once again, with rolling corrections all over the place”;
And here is CNN: “After notching heady gains this year, US stocks could be in for a back-to-school reality check. What's happening: The S&P 500 has been in the red for five consecutive trading sessions, its longest losing streak since February”;
Here is Reuters: “Investors are girding their portfolios for potential stock market volatility, even as equities hover near fresh highs after logging seven straight months of gains”;
And here is Yahoo! Finance: “Don't let the hardcore bulls tell you otherwise, the proof is in the pudding (large companies' warnings).”
They aren’t alone: equity analysts at BofA, Deutsche, Morgan Stanley, and others have all said as much in recent weeks.
“Correction” is a word the business press and equity research analysts throw around casually, but it is in fact a very specific word and a very controversial word in this context. “Correction” does not mean “returns are likely to be modest” or “things are getting riskier and volatility is likely to be higher”. Forecasting a “correction” means you have high conviction in a material decline in stock prices. It means your expected return is significantly negative over some relevant period in the future, and that negative return is likely to manifest in a sudden and sharp (rather than gradual) drop-off in valuations. It means that you think prices are not just higher than they have been in the past, but higher than they should be (i.e., higher than intrinsic values). And it means that you think prices are systematically—that is, across the market—higher than they should be.
“Correction” is kind of a euphemism for a belief that all of those very strong assumptions are simultaneously true, and true right now at that. The finance media doesn’t usually get into all of that (equity analysts tend to be a little more specific, but just barely). And the arguments they do offer tend to be specious. Consider the sampling above:
Theoreticians have been looking for a basis to justify Cramer’s belief that summer/early fall is a bad time for asset prices for quite literally 400 years and still haven’t found any (see my post on the so-called “Halloween anomaly”). I guess he gets points for observing that, empirically, results this time of year have tended not to be great, but only in the same way that Ptolemy gets points for his observations about the cosmos despite ultimately being completely wrong about the underlying structure governing his observations. The latter is what makes predictions reliable.
CNN’s claim about “five consecutive trading sessions” being “in the red” is meaningless in light of the fact that stock prices follow a random walk (past price paths don’t—or at least shouldn’t—have any bearing on future price paths).
Reuter’s suggestion that investors are nervous because stock prices keep hitting highs doesn’t make a lot of sense in light of the fact that the stock market has a positive average expected return (due to inflation, the time value of money, compensation for risk, etc.). Given that, stocks should be hitting new highs all the time without it signaling imminent peril. This concern is weirdly recited all the time, probably because it has some surface-level intuitive appeal.
Yahoo! Finance’s reasoning is the most compelling to me: companies’ management may have private info that you and I and the market don’t know about, so their warnings could be prescient. BUT the market has heard their warnings and the supposed correction hasn’t manifested despite them. Is there some reason I, specifically, should interpret their warnings as meaning stock prices are dropping 10% ASAP when thousands (millions?) of other U.S. stock market participants are yawning at them?
At the end of the day, if you believe a correction is coming, you need to believe not only that cash flows are going to soften or risk levels will increase, but further than cash flows are going to soften more or faster than the market already believes and/or that risk is increasing more or faster than the market already believes.
Whatever we are in for, “correction” probably isn’t the right word for it. Cash flows may soften more or faster than expected and/or risk might rise more or faster than expected, but if we already knew about it, the correction would already be here. Alas, it is not.
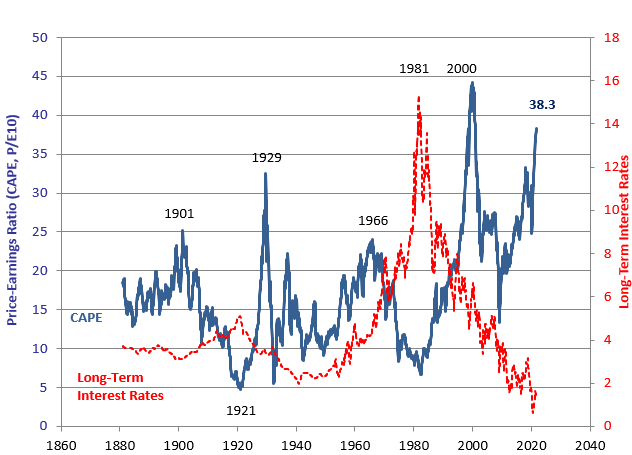
Among the cautious observers, the more sophisticated ones are probably thinking a lot about the following chart, from Nobel Laureate Robert Shiller’s website. The chart shows the price-to-earnings ratio for the stock market as a whole, where earnings are normalized by taking a simple average over the trailing 10-year period (adjusted for inflation). Earnings and prices should be linked—since prices at any moment in time should just be the capitalized value of the future earnings stream—such that the P/E ratio should mean-revert. As the chart makes clear, the ratio is high right now. For it to revert back to the long-term average, expected earnings need to rise faster than prices or, equivalently, prices need to fall faster that expected earnings. So far this year, the story has been that high expected growth in earnings would justify the high level of prices such that the prices at current levels (or higher) could be sustained with the ratio still mean-reverting. But now there is concern that real earnings growth might not be as robust as previously expected in light of the delta variant (and other emerging coronavirus variants), higher-than-expected inflation, etc. If these concerns manifest in reality, price appreciation should be lower than in recent periods.
Shiller Cyclically Adjusted Price-To-Earnings
It’s worth keeping in mind, though, that even if that story is right, it doesn’t necessarily imply some sort of dramatic, sudden double-digit depreciation in prices the likes of which the media and equity analysts are forecasting now. Another chart from Shiller makes that point clear. The chart first converts the P/E ratio described above to an implied annualized yield (higher current P/E ratio implies lower yield, lower current P/E ratio implies higher yield, all else equal). Then, the chart compares that yield to subsequent average annual stock market returns over the next 10 years. The chart is pretty clear that lower current P/E-implied yields (i.e., higher P/E ratios) correlate to lower-than-average subsequent returns.
But—and here’s the key point—high P/E ratios don’t imply sudden, shockingly catatonic returns. Just lower-than-average returns. Specifically, if you regress the subsequent returns on current P/E-implied yield, what you’ll find is that the data since 1871 implied annualized average real returns of about 3.5% percent. And that’s an average across the distribution of the entire market. That allows plenty of room for finding good opportunities without sitting in cash.
No doubt, things could change and the big decline folks have in mind could happen; but it is not likely it would occur based on things we know now. And the things we don’t know now are pretty tough to predict.
