How Stoney Point sorts stocks
In our last post, we documented the performance of our Prime and Select strategies over our first month. But as we’ve said repeatedly (see here and here), it’s not just returns that matter. Investors should care about risk-adjusted returns. That is, investors should care about how their stock picks perform relative to the risk they assumed in selecting those stocks.
By returns what we mean is the change, over a particular period of time, in the realizable market value of the stocks, as well as the value of any dividends in the period as a percentage of the initial investment. By risk what we mean is the typical variation of the returns (the standard deviation). One simple way of getting at risk-adjusted returns is to take a stock’s total return and scale it by the quantum of risk.
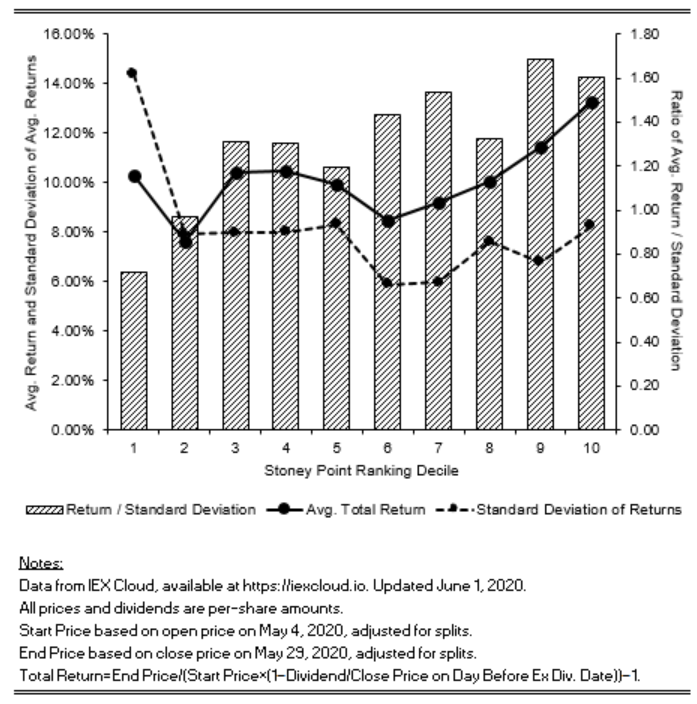
The figure below shows what happens when you take the stocks in the universe from which we draw our picks and sort them into deciles. Decile 1 includes the 10 percent of stocks in the universe that our model ranked as worst in the universe. Likewise, Decile 10 includes the 10 percent of stocks in the universe that our model ranked as best. If our model does a good of sorting stocks over time, the risk and return measures discussed above should correlate pretty well with our ranking—that is, Decile 1 should have a relatively lower average return and a higher average volatility (standard deviation), while Decile 10 should have a relatively higher average return and lower volatility. As the figure below suggests, our model did a pretty good job sorting stocks on May 2nd (when we ran the model) into groups that would ultimately exhibit relatively lower risk and relatively higher returns (e.g., Decile 10) and groups that would ultimately exhibit relatively higher risk and relatively lower returns (e.g., Decile 1) in the subsequent May 4-May 29 period.
Stay tuned for more updates and, as always, don’t forget to follow us on Twitter (@StoneyPointCap).