December 2021 performance update
2021 has officially come to a close with December rounding out a generally solid year for U.S. equities. Here are the key numbers for the month:
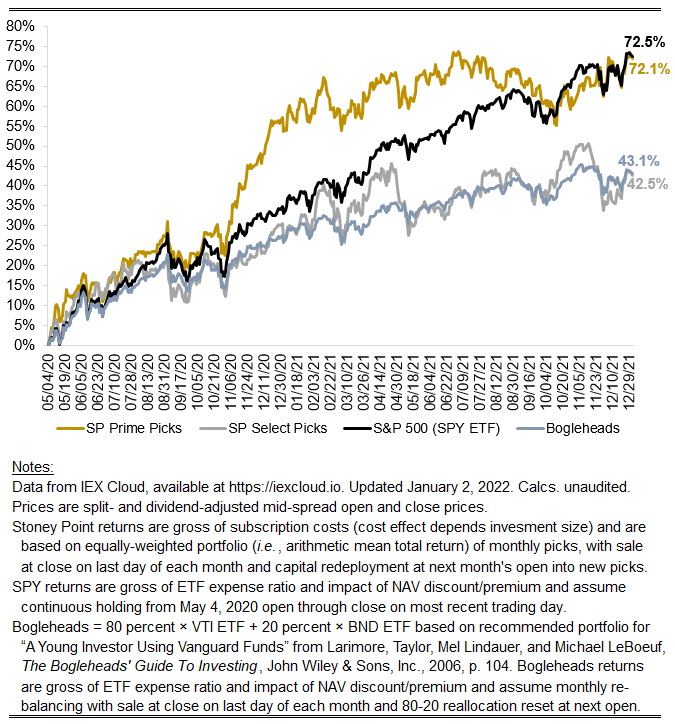
Prime: +3.69 percent
Select: +3.19 percent
SPY ETF: +3.25 percent
Bogleheads (80 percent VTI, 20 percent BND): +1.67 percent
Over the whole year, our Prime and Select returns were good, at 9.55 and 9.17 percent, respectively, relative to the base historical U.S. equity rate of return of around 5-8 percent (7.98 percent since 1928 for the S&P 500 index, according to these data). Our returns dramatically underperformed the benchmark S&P 500 index in the year itself, however (as discussed yesterday, the median U.S. equity-focused fund reporting data to Bloomberg returned 13.05 percent for the year, before management and performance fees). Hence, we start 2022 at about parity with the market as a whole on a cumulative basis, with both the SPY ETF and our Prime strategy appreciating by about 72 percent since we began.
I think there is cause for optimism about a strategy like Stoney Point’s for the year ahead.
First, conditions are such that it is very unlikely the S&P 500’s high returns of late will persist long into the future. As mentioned above, the long-term historical total return for the S&P 500 is 7.98 percent since 1928. Annualized returns for the index in 2019, 2020, and 2021 were 28.88 percent, 16.26 percent, and 26.89 percent, respectively (according to these data, which I think do not incorporate dividends, by the way). Relative to history, cumulative returns for the index in the last three years have been a 1.9-standard deviation event (a very rare occurrence).
Notably, the largest five constituents—Apple, Microsoft, Amazon, Meta (f.k.a. Facebook), and Alphabet (owner and issuer of Google)—represented 23 percent of the index in market value terms as of Dec. 29. The next two—Tesla and Nvidia—represented an additional 6 percent. That is to say that nearly 30 cents of every dollar invested in proxies for the S&P 500 is a directional bet on seven technology-adjacent companies. While Amazon was flattish, Alphabet, Microsoft, Meta, and Apple returned 65 percent, 51 percent, 34 percent, and 23 percent in the year. Tesla was up 36 percent. Devotion to these names paid off handsomely in 2021, but they are now trading at arguably euphoric levels. In P/E terms, Apple, Microsoft, Amazon, Meta, Alphabet, Tesla, and Nvidia are trading at 31.65x, 37.62x, 65.25x, and 24.07x, 27.88x, 345.13x, and 90.69x. High multiples imply the market is anticipating a great deal of future growth, but mathematically it also renders these valuations relatively more sensitive to the potential for a disruption in expectations around discount rates. Surely, the market is rationally pricing its expectations of the path of future rate hikes, but that says nothing about the standard error, or certainty, around the market’s expectations and whether or not that standard error is larger today than it has been in the past. Reality will manifest in one form or another, and if it departs from expectations in an adverse way, the market’s valuation of these growthy names should rationally come down farther than others. Big trees fall hard.
Second, and relatedly, this seems like a fortuitous time to be long “value” strategies—strategies that are inherently skeptical of high valuation multiples like the P/E’s cited above (in essence, Stoney Point’s stock selection algorithm selects stocks on the basis of a relatively novel measure of “value”). To at least some degree, all value investors believe in the notion that valuation multiples should be stationary (not increasing or decreasing monotonically) over the long term, and therefore should mean-revert when they are too high or two low. This is so because the numerators of these multiples are economically linked to the denominators in some fundamental, inexorable way. Consider price/rent ratios in the residential real estate market. When price/rent multiples are high relative to history, buyers get a better deal by renting and, all else equal, demand should flow to rentable units, raising rents and lowering purchase prices. In the process, the price/rent multiple should come down until it is “right” or until it has overshot the right level to such an extent that the reverse process occurs. This story fits both common sense and historical observation across asset classes. In my view, believing in the story does not require believing there is some big “correction” coming. It merely requires believe that, in probabilistic terms, higher-multiple assets are more likely to underperform lower-multiples assets for some period in the future.
When valuation multiples are about at their historical level, whether one believes multiples should mean-revert probably matters less. But valuation multiples today are historically high. This is not only true of U.S. stocks, but also true across a range of assets. It is true of residential real estate, where median home prices have risen 30 percent in the last decade while incomes (the basic ingredient for buying houses) rose only 11 percent. It is likewise true in the earliest-stage corner of private equities, where startup valuations in 2021 nearly doubled their level in 2020. Choosing to invest in anything in this environment requires taking a stand (consciously or unconsciously) on whether you believe the basic premise of value investing is true.